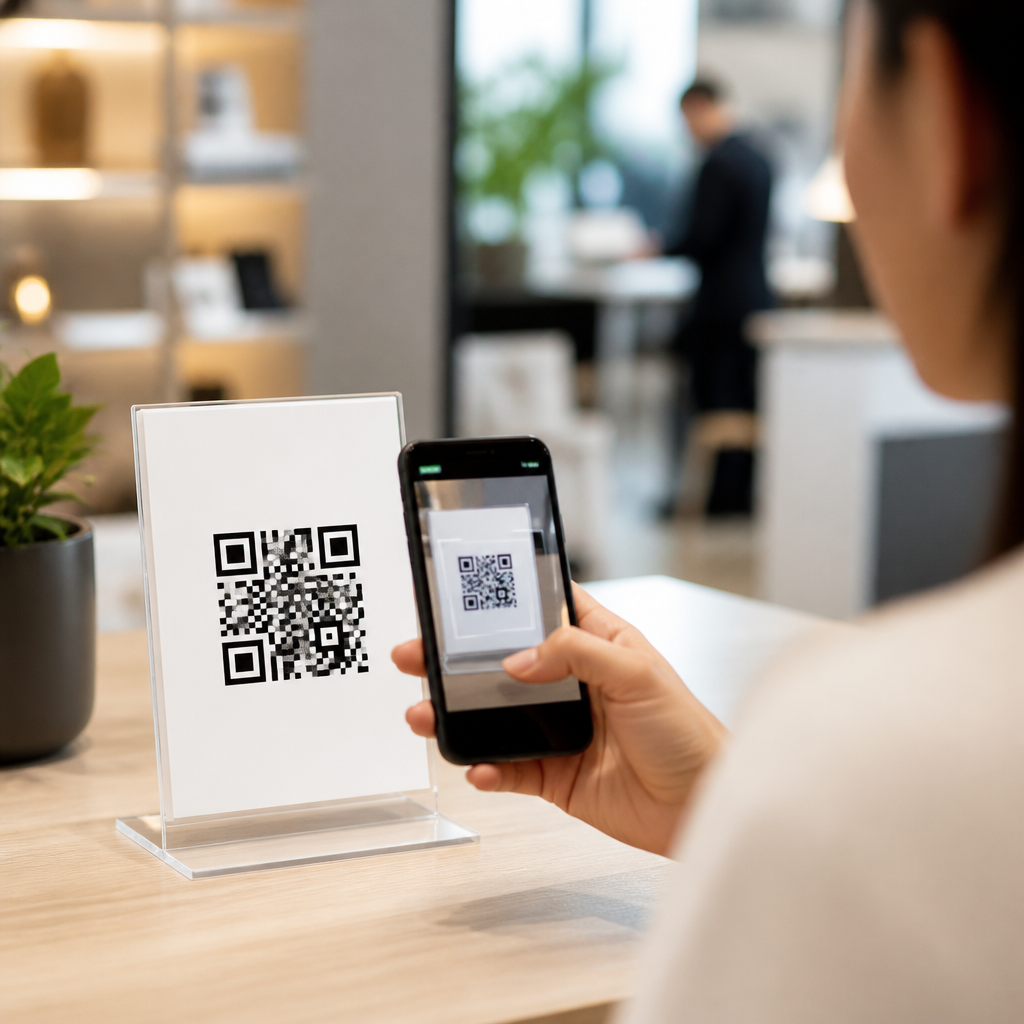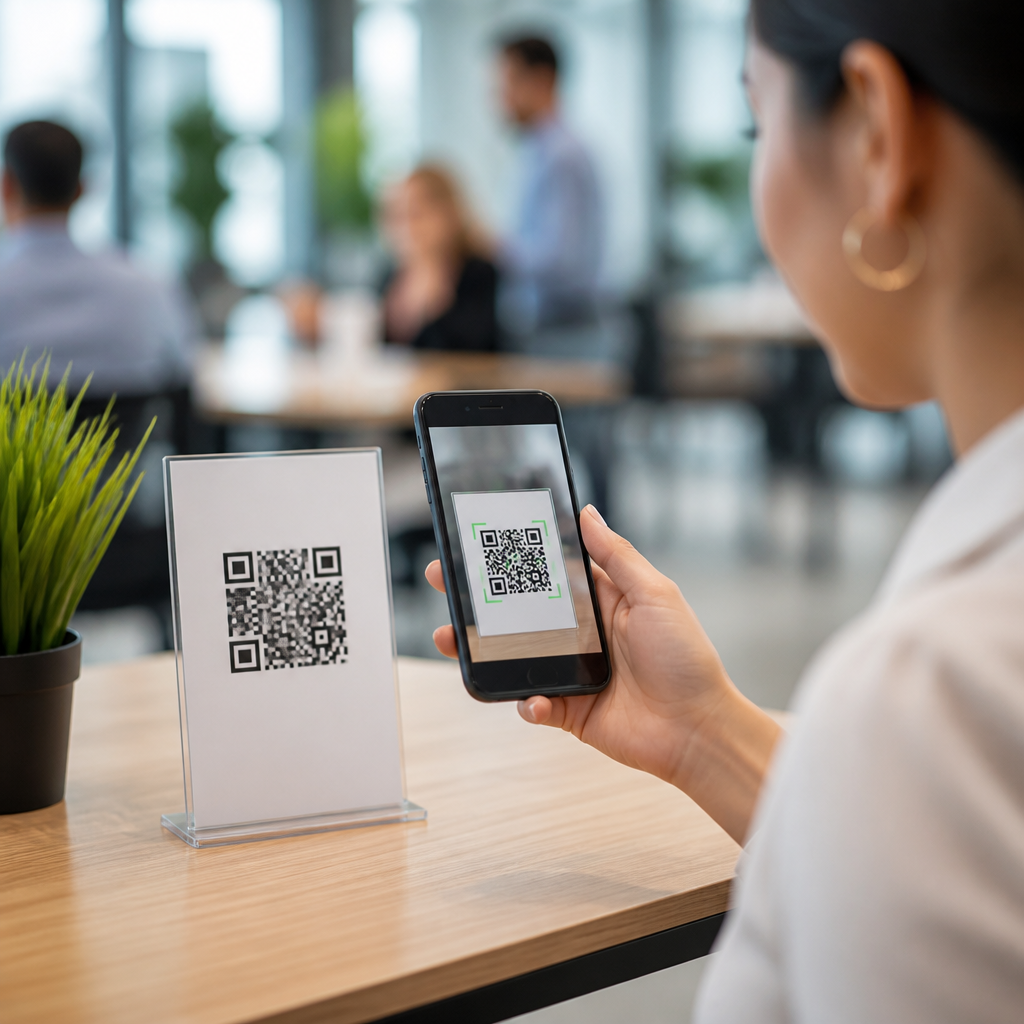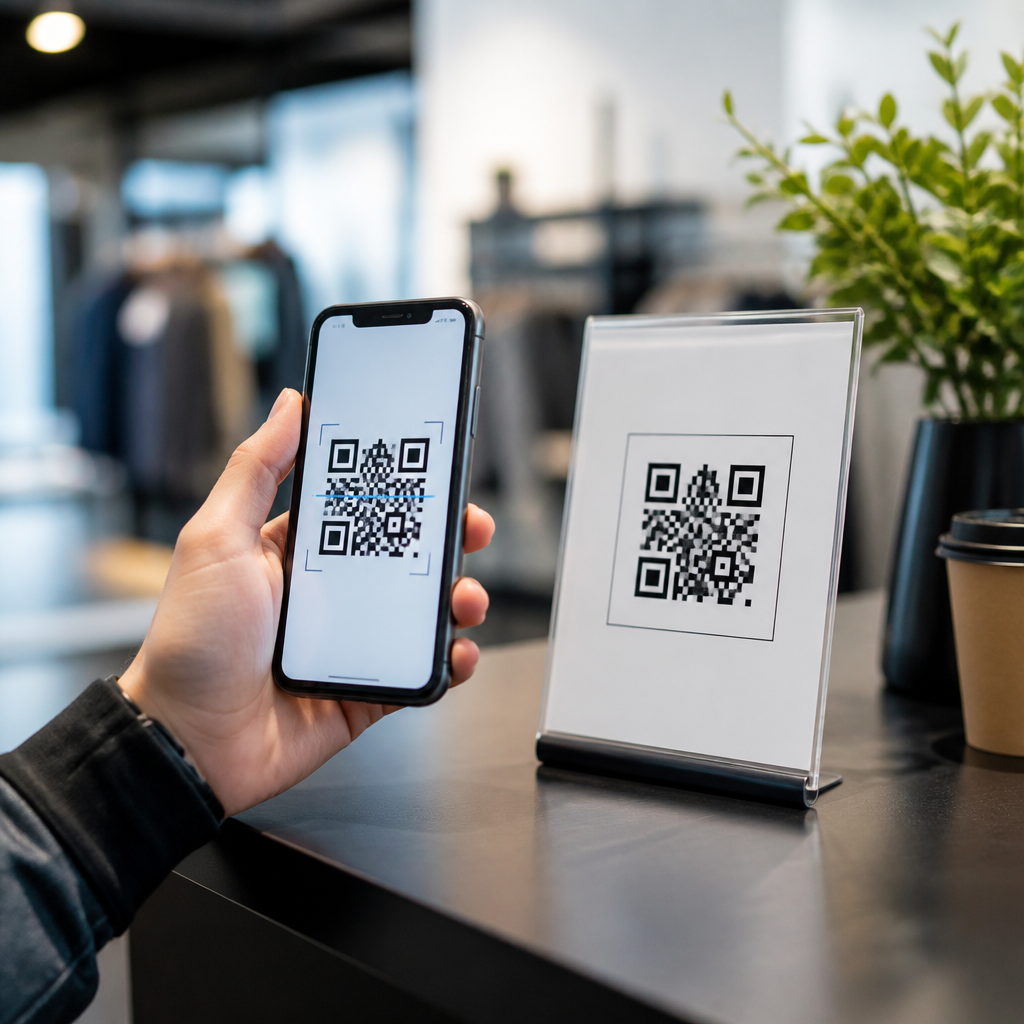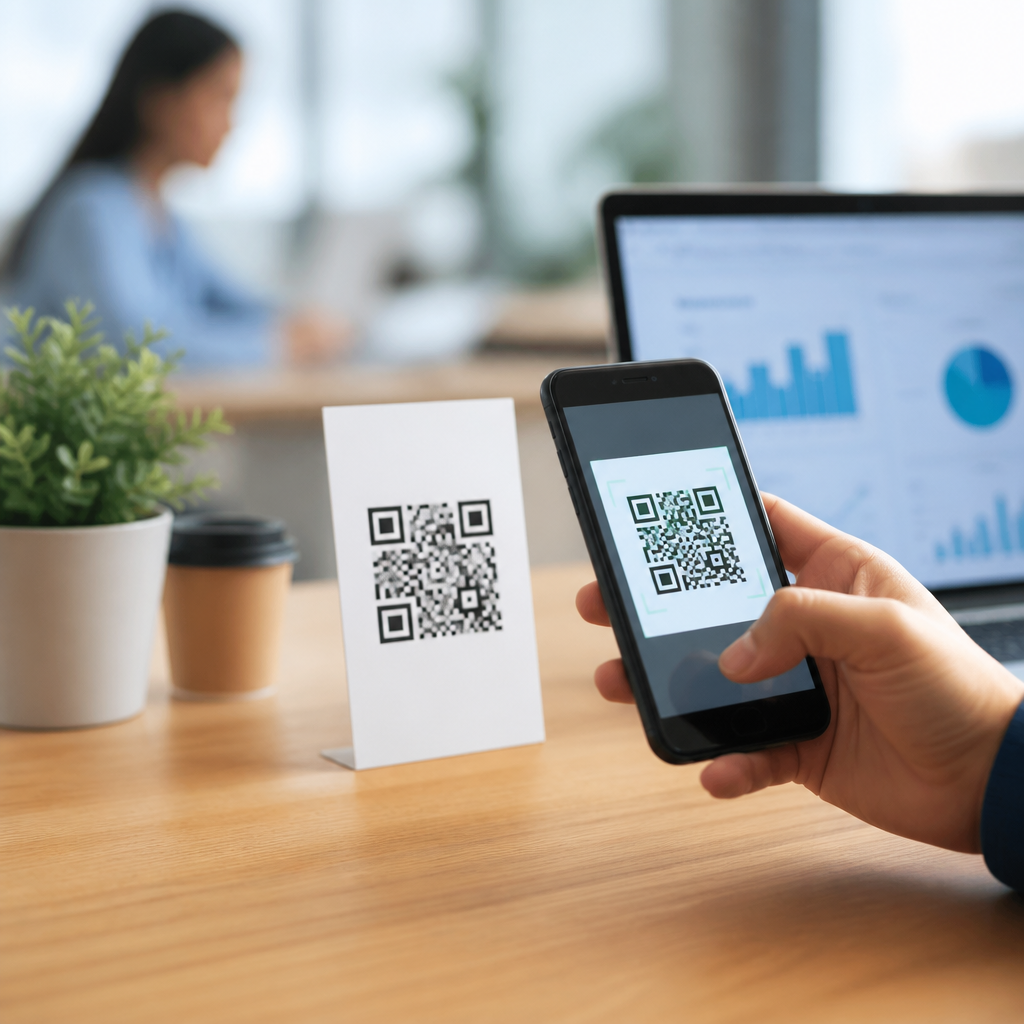

Low QR code scan rates usually come down to a short list of issues: poor placement, weak call to action, low contrast, bad sizing, audience mismatch, or a landing page that fails after the scan. If people are seeing your code but not scanning it, the problem is rarely the technology itself. It is almost always a visibility, usability, or relevance problem that can be diagnosed and fixed.
When I audit underperforming QR campaigns, I start with a simple definition. A scan rate is the percentage of people who encounter a QR code and actually scan it. If one thousand people pass a poster and twenty scan, the scan rate is two percent. That number sounds straightforward, but it sits on top of several variables: how many people truly noticed the code, whether they understood the benefit, whether their phone could scan easily, and whether the destination loaded quickly enough to create a good experience. In other words, low QR code scan rates are not one problem. They are the symptom of friction at multiple stages.
This matters because QR codes are often used at high-intent moments. They appear on packaging, menus, flyers, retail displays, direct mail, event signage, and product manuals precisely because they bridge offline attention to online action. A strong QR experience can lift coupon redemptions, app downloads, registration completions, support deflection, and product education. A weak one wastes paid media, print budget, shelf space, and customer trust. I have seen brands spend heavily on beautiful point-of-sale materials only to bury a tiny code in a reflective corner with no reason to scan. The result is predictable: traffic disappoints, teams blame the channel, and the real issue goes unresolved.
To troubleshoot correctly, it helps to separate scan rate from post-scan conversion rate. Scan rate measures whether the code gets scanned. Conversion rate measures what users do next, such as buy, sign up, watch, or download. If scans are low, focus first on noticeability, motivation, accessibility, and context. If scans are healthy but results are weak, investigate the landing page, tracking, form design, and offer. This hub article covers the most common causes, practical fixes, and the questions marketers, operators, and small business owners ask most often when QR performance lags.
Start With the Core Causes: Visibility, Value, and Friction
The fastest way to diagnose low scan rates is to test three basics in order. First, can people see the code clearly? Second, do they understand why they should scan it? Third, can they complete the action without friction? If any of these fail, scan rates drop immediately.
Visibility problems are common. Codes printed too small, placed too high, wrapped around curved packaging, or pushed into cluttered layouts are easy to miss. A practical baseline for print is at least 2 x 2 centimeters for close-range use, though many production teams use a larger rule of thumb: scanning distance divided by ten. For a code viewed from one meter away, aim for roughly ten centimeters wide. The exact size depends on error correction level, data density, and camera quality, but tiny codes consistently underperform.
Value problems are just as damaging. Many materials show a QR code with no instruction beyond “Scan me,” which is not a compelling offer. People need a reason: “Scan for a 15% discount,” “Scan to see installation steps,” or “Scan to check ingredient sourcing.” In store tests, adding a specific benefit often improves scans more than changing the code design. The code is only the bridge; the promise is what motivates the action.
Friction includes anything that makes the process feel inconvenient or risky. Examples include low-contrast printing, glossy surfaces that reflect overhead lights, destination pages that are not mobile optimized, URLs that trigger browser warnings, and app-gated experiences that demand too much too soon. Since most modern phones support native scanning in the camera app, the bar is high for a good experience. If your campaign introduces unnecessary steps, users abandon it.
Common Design and Placement Mistakes That Reduce QR Code Scan Rates
Most low-performing QR codes fail in the physical environment before users ever reach the content. Placement determines discoverability, and discoverability determines whether the code has any chance to earn a scan. A code on a tabletop menu behaves differently from a code on a billboard, a medicine box, or an airport sign. Context dictates optimal size, quiet zone, viewing angle, and dwell time.
The quiet zone is one of the most overlooked technical requirements. QR codes need blank space around the symbol so cameras can distinguish the code from surrounding graphics. Industry guidance commonly calls for a margin of at least four modules wide. When designers place a code directly against text, borders, or patterned backgrounds, scan reliability suffers. I have seen well-branded layouts become unreadable because the code was squeezed into a badge shape without sufficient clear space.
Color choices matter too. High contrast works best, especially dark modules on a light background. Reversed designs, gradients, and branded color palettes can be used, but only if contrast remains strong. Light gray on pastel beige may look elegant on screen and fail in the real world. Print production introduces another risk: ink gain, substrate texture, and laminate glare can distort edges enough to reduce readability.
Placement should match natural eye flow and body movement. On packaging, front or side panels near product benefits usually beat bottom panels. On posters, codes placed below the main message and above dense legal text perform better because users see the promise first, then the action. On restaurant tables, a code near the center with a short instruction outperforms one tucked beside condiment holders. On out-of-home placements, scanability drops sharply when people are moving, too far away, or unable to stop safely.
| Issue | Why It Hurts Scan Rate | Practical Fix |
|---|---|---|
| Code too small | Phones struggle to resolve detail at typical viewing distance | Increase size based on distance; test with multiple devices |
| Low contrast | Cameras cannot separate modules from background cleanly | Use dark-on-light colors and avoid subtle brand palettes |
| No quiet zone | Surrounding graphics interfere with symbol detection | Keep clear space of at least four modules around the code |
| Poor placement | Users do not notice the code or cannot stop to scan | Put codes at eye level or hand level where dwell time exists |
| Reflective surface | Glare blocks phone cameras from reading the code | Use matte finishes or reposition away from direct light |
Why Your Offer, Context, and Audience Fit Matter More Than the Code Itself
A QR code is not persuasive by itself. Users scan when the reward feels immediate, relevant, and worth the interruption. That is why the same code format can thrive in one context and fail in another. A tabletop code promising faster ordering solves a clear problem. A transit shelter code asking commuters to fill out a six-field form asks too much in a rushed setting.
Audience fit is central. If your customers are already in a buying mindset, product demos, coupons, warranty registration, and comparison guides can work well. If they are browsing casually, the ask should be lighter, such as “See colors in your room” or “Watch a 20-second setup video.” I have watched teams blame low scan rates on creative execution when the actual issue was mismatch between audience intent and destination task.
The surrounding message also changes behavior. Specific instructions outperform vague prompts because they reduce uncertainty. “Scan to view today’s lunch menu” is better than “Scan for more.” “Scan to enter the giveaway by Friday” is better than “Learn more.” Deadlines, savings, exclusivity, and utility all help, but they must be genuine. If the destination disappoints, future scans decline because users learn quickly which brands waste their time.
Trust signals influence scan behavior more than many marketers expect. People are cautious about unknown links in physical spaces, especially after repeated security warnings about phishing. Branded short domains, recognizable logos, and copy that clearly states the destination can increase confidence. A QR code next to “Open acme.com/support to download the official guide” feels safer than an unlabeled code on an unbranded handout.
Technical Problems After the Scan Can Make Scan Rates Look Worse
Sometimes the code is being scanned, but your reporting makes performance appear weaker than it is. This happens when redirects fail, analytics tags are missing, campaign parameters are inconsistent, or privacy settings suppress some attribution. Before redesigning the asset, verify that tracking is sound.
Dynamic QR codes are useful because they allow destination changes and scan analytics without reprinting the code. They also introduce dependencies: the QR platform must resolve quickly, SSL certificates must remain valid, and redirect chains must stay short. Long redirect paths can increase latency, and slow loading is expensive. According to Google’s long-established mobile performance findings, even small increases in page load time can reduce engagement materially. In practical terms, if a user scans in a low-signal environment and the page stalls, the campaign loses momentum.
Destination quality matters as much as code readability. The landing page should be mobile first, lightweight, and tightly matched to the promise on the sign or package. If a code says “Watch setup instructions,” do not send users to a generic homepage where they must search again. Deep link them to the exact content. If a code offers a coupon, surface it immediately without forcing account creation first. Every extra tap reduces completion.
Testing should cover different phones, camera apps, operating systems, lighting conditions, and network environments. iPhone and Android devices are generally reliable, but older devices, cracked screens, dark mode overlays, and aggressive in-app browsers can expose issues. In my own test plans, I always scan from the expected distance, under retail lighting, and on the actual printed substrate. Studio proofs often hide field problems.
How to Troubleshoot Low QR Code Scan Rates Systematically
Use a disciplined process rather than changing everything at once. Start by confirming that scans are truly low relative to exposure. If possible, estimate impressions from foot traffic, distribution counts, shelf encounters, or event attendance. Then compare placements, messages, and outcomes across assets. A poster by the entrance may underperform while a counter display succeeds, revealing a context issue rather than a code issue.
Next, run a physical audit. Check size, contrast, quiet zone, glare, curvature, and obstruction. Scan from realistic angles and distances. Ask someone unfamiliar with the campaign to explain what they think will happen after they scan. If they cannot answer confidently, your call to action is weak. Then review the destination experience: load speed, message match, form length, autoplay behavior, cookie banners, and app prompts.
After diagnosis, prioritize high-impact fixes. Usually the order is simple: improve the benefit statement, enlarge the code, move it to a higher-attention area, reduce landing-page friction, and clean up tracking. A/B testing helps when volume supports it. On direct mail, for example, you can test “Scan for pricing” against “Scan for a personalized quote” and measure scan lift. In retail, you can compare shelf talkers with a benefit-led headline versus product-spec-led copy.
Governance is important if you manage QR codes across teams. Establish production standards for minimum size, clear space, approved color treatments, destination rules, and QA steps. Use a naming convention in analytics so scans from packaging, signage, inserts, and support documents are easy to compare. Without a system, organizations repeat avoidable mistakes campaign after campaign.
Frequently Asked Questions About Low QR Code Performance
What is a good QR code scan rate? There is no universal benchmark because exposure quality varies dramatically by channel. Packaging inserts may produce strong scan rates because users are already engaged, while outdoor signage often produces lower rates due to movement and distance. Compare performance within the same environment first.
Do branded QR codes hurt performance? They can if branding reduces contrast, distorts finder patterns, or removes too much data area. Tasteful branding with proper testing is usually fine. Aggressive customization often sacrifices reliability for style.
Should I use a static or dynamic QR code? Use static codes for simple permanent destinations and dynamic codes when you need analytics, editable links, or campaign management. Dynamic codes are more flexible, but choose a reputable provider and monitor redirect uptime.
Why do some users say the code does not work? Common causes include poor printing, glare, low battery camera performance, outdated devices, broken redirects, captive Wi-Fi interruptions, or destination pages blocked by security settings. Always provide a fallback short URL nearby.
Can too many QR codes on one page reduce scans? Yes. Multiple codes create choice overload and scanning errors. Each asset should usually have one primary action. If you need several destinations, build a single mobile landing page with clear options.
What to Fix First to Increase Scans Fast
If you need quick wins, focus on the factors with the highest probability of improvement. Add a specific benefit-led call to action. Make the code larger. Increase contrast and quiet zone. Move the code to a place with better dwell time. Send users to a faster, more relevant mobile page. Add a visible fallback URL. Then test again in the real environment, not just on a designer’s monitor.
Low QR code scan rates are rarely mysterious. They reflect friction between attention and action. When the code is easy to notice, easy to trust, easy to scan, and tied to a clear benefit, performance improves. When any link in that chain breaks, scans fall. The advantage of QR troubleshooting is that most fixes are concrete, measurable, and inexpensive compared with reworking an entire campaign.
Use this page as your hub for QR code FAQs and troubleshooting, then apply the same discipline across packaging, signage, print, events, and support content. Audit one asset this week, document the friction you find, and fix the highest-impact issue first. Better scan rates usually follow quickly.
Frequently Asked Questions
Why are people seeing my QR code but not scanning it?
If people are clearly noticing your QR code but scan rates are still low, the issue is usually not the code itself. In most cases, the problem is friction. A QR code can be technically valid and still underperform if it is placed in the wrong spot, lacks context, or does not give people a compelling reason to act. Many campaigns fail because the code is visible but not actionable. For example, a code on a poster may be too far away to scan comfortably, placed where lighting creates glare, or shown in a fast-moving environment where people do not have enough time to respond. Even when the code is easy to see, people often ignore it if they do not immediately understand what they will get from scanning.
A weak or missing call to action is one of the most common causes. If the code just sits there without language such as “Scan to get pricing,” “Scan for the menu,” or “Scan to claim your discount,” users have to guess what happens next. Most will not bother. Relevance also matters. If the audience does not see a clear benefit, they will move on. Low scan rates are often a visibility, usability, or motivation problem rather than a technology problem, which is good news because those issues can usually be diagnosed and improved quickly.
What is a good QR code scan rate, and how should I measure it?
A scan rate is generally the percentage of people who had a realistic opportunity to see the QR code and then actually scanned it. That sounds simple, but measuring it properly depends on context. In a direct mail campaign, you might compare scans to total pieces delivered. In a retail store, you may compare scans to foot traffic near the display. At an event, you might compare scans to total attendees or to the number of people who passed a specific booth or sign. The key is choosing a denominator that reflects actual exposure, not just distribution. If you use the wrong baseline, the numbers can look worse or better than they really are.
There is no universal benchmark that applies to every campaign because environment, audience intent, offer quality, and placement all influence results. A QR code on product packaging for loyal customers behaves very differently from a QR code on a street poster aimed at passersby. What matters most is consistency in tracking and comparison. Measure scans by location, format, time period, and audience segment. Also go beyond the first scan. If people scan but bounce immediately, your problem may be the landing page rather than the code. The most useful audit looks at the full path: opportunity to view, scan, page load, and post-scan conversion.
How do placement and size affect QR code scan rates?
Placement and size have a huge impact on performance because they determine whether the code is practical to scan in the real world. A QR code may look fine in a design mockup but fail in actual conditions if it is too small, too high, too low, too far away, or placed where users cannot comfortably stop and scan. The farther away the viewer is, the larger the code needs to be. If someone is expected to scan from a few feet away, a small code might work. If the code is on signage, a storefront window, or a banner, it often needs to be significantly larger to allow phones to capture it quickly and accurately.
Placement should also match behavior. A code on the back of a moving bus is a classic example of poor real-world usability because viewers may not have enough time to open their camera and lock onto the code. A code placed near a checkout counter, table tent, product shelf, trade show display, or direct mail piece usually performs better because people can pause and interact. You should also consider surrounding clutter. If the code is buried inside a busy layout, users may not even recognize it as something intended for scanning. Good placement makes the code obvious, reachable, and easy to use without forcing effort from the audience.
Can design choices like color contrast and styling reduce QR code performance?
Yes, absolutely. QR codes can be customized, but readability always matters more than visual flair. One of the biggest design mistakes is low contrast. If the foreground and background are too similar in tone, smartphone cameras may struggle to distinguish the code pattern, especially in dim lighting or on reflective surfaces. Dark code on a light background is typically the safest option. Inverted styles, pastel-on-pastel combinations, metallic printing, or designs placed over complex imagery often look attractive in a brand presentation but perform poorly in practice.
Over-stylization can also hurt scan reliability. Rounded modules, embedded logos, decorative frames, and branded colors are all possible, but they need to be tested carefully across multiple devices and lighting conditions. Print quality matters too. A code that appears crisp on screen may blur when printed too small or on low-quality material. If the quiet zone, the blank space around the code, is reduced or crowded by nearby graphics, scanning can become less consistent. The safest approach is to prioritize strong contrast, adequate white space, and realistic testing before launch. If performance is low, simplifying the design is often one of the fastest improvements you can make.
What if people scan the QR code, but conversions are still low after the scan?
If scans are happening but results are still weak, the problem has moved beyond the QR code and into the post-scan experience. This is extremely common. A QR code can successfully generate curiosity, but if the landing page is slow, broken, confusing, or irrelevant, users drop off immediately. Start by checking basic functionality. Does the page load quickly on mobile data? Is it mobile-friendly? Does it match the promise of the call to action? If the code says “Scan for 20% off” but the landing page opens to a generic homepage, people lose trust fast. The transition from scan to destination should feel direct and intentional.
You should also review usability and conversion flow. If visitors have to pinch and zoom, dismiss pop-ups, hunt for information, or complete a long form, many will abandon the process. Audience expectation matters here as well. Someone scanning in a store aisle or at an event usually wants a fast experience, not a complicated journey. The landing page should deliver a single clear outcome, such as viewing a menu, claiming an offer, watching a short demo, or accessing product details. In many low-performing campaigns, the QR code gets blamed when the real issue is that the destination does not fulfill the user’s intent. Fixing the landing page often improves campaign performance more than changing the code itself.