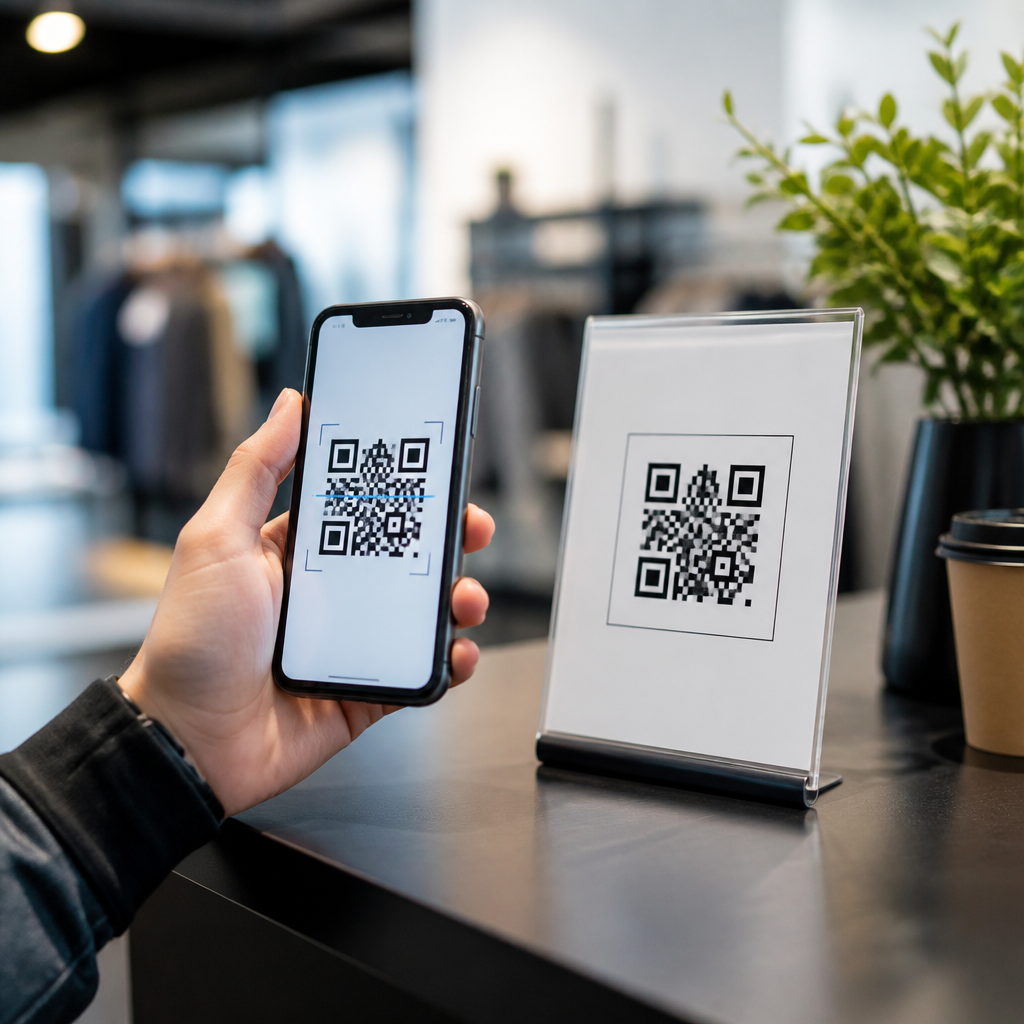

A QR code campaign planning worksheet gives marketers, educators, event teams, retailers, and nonprofits a structured way to design, launch, measure, and improve QR-driven experiences without missing critical details. In practical terms, it is a repeatable document, usually downloadable as a PDF, spreadsheet, or editable template, that captures campaign goals, audience segments, landing page requirements, code format choices, placement plans, analytics tags, testing steps, and post-launch review notes. I have used planning worksheets for product packaging rollouts, conference signage, direct mail, restaurant table tents, and field sales collateral, and the pattern is consistent: teams that document the campaign before generating codes avoid costly mistakes such as broken links, poor scan placement, weak mobile pages, and untrackable traffic.
This topic matters because QR codes compress an entire customer journey into a single scan. The code itself is simple, but the surrounding decisions determine whether the campaign drives conversions or becomes ignored print clutter. A strong worksheet turns abstract ideas into operational choices: what the scan should achieve, where users will encounter it, what device conditions they are in, what incentive they receive, and how success will be measured. As a hub for downloadable resources within QR Code Tutorials, Guides & Resources, this article explains what a campaign planning worksheet should include, how to use it, and which supporting templates, checklists, and reference documents belong in a complete resource library.
At its best, a QR code campaign planning worksheet acts as both a briefing tool and a quality-control system. It aligns marketing, design, web, analytics, and print vendors around one source of truth. It also creates documentation that is useful long after launch, especially when teams compare performance across channels such as packaging, posters, menus, handouts, storefront displays, and email follow-ups. If you want downloadable resources that save time and improve scan performance, start with the worksheet, then build a connected set of templates around it.
What a QR Code Campaign Planning Worksheet Should Contain
The core purpose of a QR code campaign planning worksheet is to force complete planning before production starts. A useful worksheet begins with campaign identification fields: project name, owner, business unit, launch date, end date, and version history. That sounds basic, but version control matters when codes appear across multiple assets and vendors. I have seen teams print an outdated QR destination because a designer used an older link file; a worksheet with approval fields prevents that.
Next, the worksheet should define the objective in one sentence. Common objectives include collecting leads, driving app downloads, redeeming coupons, sharing product instructions, confirming event attendance, registering warranty information, or routing users to a localized menu. Each objective needs a primary metric and a secondary metric. For example, if the primary goal is signups, the main metric may be completed forms, while the secondary metric may be scan-through rate by placement. Without that distinction, teams optimize for scans instead of outcomes.
The audience section should capture who is scanning, where they are, and what constraints they face. A commuter scanning a transit ad has seconds of attention and limited bandwidth. A shopper scanning product packaging in-store may need pricing, ingredient, or comparison information immediately. An event attendee scanning a badge insert may already be motivated and willing to complete a longer form. Good worksheets require teams to note context, intent, and friction points because mobile behavior changes by environment.
Technical fields are equally important. The worksheet should specify static versus dynamic QR code type, destination URL, UTM parameters, redirect ownership, error fallback page, brand domain usage, and whether the code will be regenerated or redirected later. Dynamic codes are generally better for campaigns because they allow destination changes and scan analytics, but they require reliable platform management. Static codes can be appropriate for permanent information such as Wi-Fi credentials or long-lived product instructions where the destination will never change.
Creative and production fields should document call-to-action copy, minimum print size, required quiet zone, foreground-background contrast, logo usage, file format, and placement mockups. ISO/IEC 18004 defines the QR Code symbology standard, but teams still make practical mistakes that hurt scanability, especially with low contrast, glossy surfaces, curved packaging, and overdesigned center logos. A worksheet should capture all those risk factors before files go to print.
How to Structure the Downloadable Resource Library
Because this page serves as a hub for downloadable resources, the worksheet should anchor a broader library rather than stand alone. In my experience, the most useful resource set is modular. Different teams need different levels of detail, but they should all map back to the same planning logic. A complete library usually includes a master worksheet, a campaign brief template, a QR code testing checklist, a print placement guide, a landing page review sheet, an analytics tagging template, and a post-campaign reporting template.
The master worksheet is the central planning document. The campaign brief template helps stakeholders summarize the business case and target audience. The testing checklist ensures every code is scanned across iPhone and Android devices, multiple camera apps, varying lighting conditions, and expected distances. The print placement guide addresses production variables such as substrate, finish, and viewing angle. The landing page review sheet covers page speed, form length, mobile responsiveness, and message match. The analytics template standardizes source, medium, campaign, content, and location naming. The reporting template closes the loop by documenting scans, sessions, conversions, bounce rate, assisted revenue, and lessons learned.
When these downloads are built to work together, they reduce handoff friction. A designer can pull the exact CTA and size requirements from the worksheet. A web team can use the landing page sheet to confirm above-the-fold content. An analyst can ingest the naming convention from the UTM template directly into GA4, Adobe Analytics, or another reporting stack. A field marketer can compare actual placement photos with the original plan. That operational coherence is the real value of a downloadable resource hub.
| Resource | Primary Use | Best Format | Key Fields |
|---|---|---|---|
| Campaign Planning Worksheet | Pre-launch planning | Spreadsheet | Goal, audience, URL, CTA, placement, owner, dates |
| Testing Checklist | Quality assurance | Device tests, lighting, distance, redirects, fallback | |
| Analytics Tagging Template | Measurement consistency | Spreadsheet | UTM source, medium, campaign, content, location |
| Landing Page Review Sheet | Conversion readiness | Document | Load time, form fields, message match, CTA clarity |
| Post-Campaign Report | Performance analysis | Slide or sheet | Scans, sessions, conversion rate, insights, next steps |
Planning Goals, Audiences, and Offers That Convert
A QR campaign fails most often when the offer is weak or vague. The worksheet should require a precise value exchange: why should someone scan right now? Effective answers include instant discounts, exclusive content, product setup help, entry into a giveaway, digital tickets, loyalty enrollment, contactless ordering, or personalized recommendations. “Scan me” is not a sufficient call to action. “Scan to get 15% off today,” “Scan for assembly video,” and “Scan to view ingredients and allergen info” are specific and convert better because they reduce ambiguity.
Audience planning should move beyond demographics and focus on user state. Are they curious, rushed, skeptical, repeat buyers, or first-time visitors? In retail, I have seen ingredient transparency and how-to video destinations outperform generic product pages because shoppers want decision support, not corporate navigation. In B2B trade shows, a QR code to a short lead capture form often performs worse than a code to a single high-value asset like a benchmark report, followed by optional email capture on the next screen. The worksheet should include a field for expected user intent and a field for the minimum information needed after the scan.
The offer also has to match channel economics. A printed mailer can justify a stronger incentive because print and postage costs are higher. A menu insert may not need a discount at all if the real value is speed, such as instant ordering or allergen access. A museum placard may prioritize educational enrichment over conversion. Capturing this rationale in the worksheet helps teams avoid copying tactics from unrelated campaigns.
Finally, the worksheet should define the desired path after the scan. Is it one-step conversion, browse then convert, store locator, or support journey? This matters for landing page design, analytics setup, and success benchmarks. A frictionless path beats a clever one. If the user can complete the action in under a minute on a mobile device, the campaign has a stronger chance of succeeding.
Design, Placement, and Scanability Standards
Even strong offers fail if the code cannot be scanned easily. The worksheet should therefore include nonnegotiable design standards. Minimum size depends on scanning distance, but a practical baseline for print is at least 2 x 2 centimeters for close-range use, with larger sizes for posters, shelf talkers, and window signs. The common rule of thumb is roughly a 10:1 viewing-distance-to-code-size ratio, though testing in the exact environment matters more than theory. A poster scanned from two meters away needs a much larger code than packaging held in the hand.
Contrast should be high, ideally dark modules on a light background. Reversed codes, patterned backgrounds, and low-contrast brand colors often reduce readability. Quiet zone, the clear margin around the code, must remain intact; clutter too close to the symbol is a frequent failure point. If a brand logo is inserted, error correction can help, but excessive modification still harms scanability. In production reviews, I routinely ask for test prints, not just on-screen approvals, because matte versus gloss, curvature, lamination, and shadows affect camera detection.
Placement is equally strategic. Codes should appear where the user has enough time and physical ability to scan. A QR code on a moving vehicle is mostly decorative. A code at the bottom of a long poster may be blocked by foot traffic. A table tent works because the user is stationary. Packaging can work well if the code is on a flat surface and paired with a clear benefit statement. The worksheet should prompt for location photos, expected traffic flow, lighting conditions, and whether mobile signal is reliable at the scan point.
Accessibility should not be skipped. Always provide a short URL or alternative path near the code. Some users cannot scan easily, some devices have camera limitations, and some settings restrict app switching. A worksheet field for alternate access ensures the campaign remains usable and compliant with basic inclusive design principles.
Tracking, Testing, and Post-Launch Improvement
A QR code campaign planning worksheet is incomplete without a measurement and optimization framework. At minimum, the document should define how scans will be tracked, where website behavior will be measured, and who owns weekly review. Many QR platforms report scans, time, and rough geography, but those metrics should be reconciled with on-site analytics. A scan is not a session, and a session is not a conversion. Redirect delays, privacy settings, and bot filtering can create discrepancies, so the worksheet should note the source of truth for each KPI.
UTM governance belongs in the worksheet, not as an afterthought. Standard naming conventions prevent reporting chaos when multiple teams launch codes simultaneously. For example, source might be qr, medium might be print, campaign might be spring_menu_launch, content might identify the asset, and term or custom dimensions might capture store or placement. In GA4, creating explorations by location and asset version becomes much easier when naming rules are documented before launch.
Testing should happen in stages: pre-production, post-print, in-location, and after launch. Pre-production confirms the URL, redirect, and analytics tags. Post-print testing checks physical scanability. In-location testing verifies signal conditions, user flow, and page load speed at the actual site. After launch, teams should monitor bounce rate, conversion rate, and drop-off points. If a code scans well but conversions lag, the issue is usually the landing page, form burden, or message mismatch rather than the code itself.
The post-campaign section of the worksheet should ask what worked, what failed, and what should be standardized. That is how a single campaign becomes an institutional resource. Build your downloadable worksheet library, use it on every deployment, and keep refining it with real scan data so each new QR code campaign starts smarter than the last one.
Frequently Asked Questions
What is a QR code campaign planning worksheet, and why is it useful?
A QR code campaign planning worksheet is a structured document used to organize every important decision involved in a QR-based campaign before anything is printed, published, or promoted. Instead of treating a QR code as a simple add-on, the worksheet turns it into part of a complete strategy. It typically includes sections for campaign objectives, target audience, call to action, destination URL or landing page, code type, design requirements, placement locations, tracking parameters, testing steps, launch timing, and post-campaign evaluation. By putting all of those details in one place, teams can move from idea to execution with fewer mistakes and much better alignment.
The value of the worksheet is that it reduces guesswork and prevents common oversights. Many QR campaigns fail not because the technology is flawed, but because planning is incomplete. A code may lead to an unoptimized mobile page, appear in a spot with poor lighting, use the wrong tracking links, or send users to content that does not match their expectations. A worksheet helps catch these issues early. It also makes collaboration easier across marketing teams, educators, event coordinators, store managers, nonprofit staff, designers, and analysts, because everyone is working from the same plan rather than scattered notes or assumptions.
Just as importantly, a repeatable worksheet creates consistency across future campaigns. Whether the goal is driving donations, sharing lesson materials, promoting an event agenda, collecting leads, or linking shoppers to product details, the same planning framework can be reused and improved over time. That makes the worksheet not only a launch tool, but also a learning tool that helps teams document what worked, what did not, and what should be changed in the next QR initiative.
What information should be included in a QR code campaign planning worksheet?
A strong QR code campaign planning worksheet should begin with the campaign foundation: the name of the campaign, the owner or responsible team, the timeline, and the main objective. The objective should be specific and measurable, such as increasing event registrations, encouraging product page visits, collecting email signups, distributing educational resources, or directing donors to a contribution page. This section should also clarify the primary audience and, if relevant, secondary audience segments. Knowing exactly who will scan the code helps shape the design, messaging, placement, and destination experience.
Next, the worksheet should document the user journey. That means identifying where the QR code will appear, what the viewer will see before scanning, what action they are expected to take, and what happens after the scan. The landing page or digital destination should be described in detail, including its URL, mobile-friendliness, page load speed, form fields, content offer, and call to action. If the campaign uses dynamic QR codes, redirects, app links, PDFs, videos, menus, or registration forms, those elements should also be recorded. This part of the worksheet ensures that the code is connected to a purposeful experience rather than just a generic link.
Operational details are equally important. A complete worksheet should include the QR code format, branding specifications, size requirements, color choices, file format for production, and any error correction considerations. It should also include placement plans such as posters, packaging, classroom handouts, event signage, direct mail, table tents, or retail displays. In addition, there should be a tracking section for UTM parameters, analytics tools, conversion goals, A/B testing ideas, and scan reporting. Finally, the worksheet should end with a testing checklist and a post-launch review section so the team can verify functionality before release and evaluate performance afterward using real results instead of assumptions.
How do you set goals and measure success for a QR code campaign?
The most effective way to set goals for a QR code campaign is to connect the QR experience to a larger business, educational, fundraising, or event outcome. A QR code should never be the goal by itself; scans are only one indicator. The worksheet should define what the campaign is truly meant to achieve. For example, a retailer may want more product-page views that turn into purchases, an event organizer may want faster attendee check-ins or schedule downloads, an educator may want improved access to assignments or learning materials, and a nonprofit may want more donations or volunteer signups. These goals should be framed as measurable outcomes with clear targets, timelines, and ownership.
Measurement should include both engagement metrics and conversion metrics. Engagement metrics often include total scans, unique scans, scan location, time of scan, device type, and click-through activity after the scan. Conversion metrics are more outcome-focused and may include completed purchases, submitted forms, donations, registrations, downloads, appointments booked, or videos watched to a certain percentage. Including both types of measurement in the worksheet is essential because a high scan count does not automatically mean the campaign succeeded. If many people scan but few complete the desired action, the problem may be the landing page, the offer, or the message rather than the code itself.
To make performance data trustworthy, the worksheet should specify tracking methods before launch. That usually means adding UTM parameters, connecting analytics platforms, defining conversion events, and making sure the destination page is set up correctly for reporting. It is also helpful to compare results by placement or audience segment. A QR code on product packaging may perform differently than the same code on a window display or email flyer. By reviewing scan behavior alongside conversion performance, teams can identify what actually drove results and use those insights to improve future campaigns with better targeting, better placement, and stronger calls to action.
What are the most common mistakes to avoid when using a QR code campaign planning worksheet?
One of the most common mistakes is treating the worksheet as a formality instead of a decision-making tool. If teams fill it out quickly without thinking through audience behavior, content relevance, or scan context, the campaign may still launch with avoidable flaws. Another frequent issue is using vague goals such as “increase engagement” without defining what engagement means. A worksheet should force specificity. If the desired outcome is newsletter signups, product purchases, event check-ins, or PDF downloads, that should be stated clearly so success can actually be measured.
Another major mistake is failing to plan the post-scan experience. A QR code can be perfectly designed and placed, yet still underperform if it leads to a slow, confusing, non-mobile-friendly, or irrelevant destination. Many teams focus heavily on the printed code but not enough on the landing page. The worksheet should make room for content review, mobile testing, form simplicity, branding consistency, and user intent. People scan because they expect convenience and immediate value. If the destination does not deliver that quickly, they drop off. In that sense, the landing page is often more important than the code itself.
Technical and placement errors are also common and should be actively prevented through the worksheet. Examples include printing codes too small, placing them where lighting is poor, stretching or recoloring them in ways that hurt scannability, forgetting analytics tags, or skipping testing across different devices and camera apps. Some teams also fail to include a clear call to action next to the code, assuming people will scan without being told why. A worksheet helps avoid these problems by creating checkpoints before launch. It encourages teams to verify that the code scans easily, appears in practical locations, links to the right destination, and supports a clear user benefit.
Who should use a QR code campaign planning worksheet, and how can different teams adapt it?
A QR code campaign planning worksheet is useful for almost any organization or team that uses QR codes as part of a planned communication, marketing, educational, fundraising, or operational effort. Marketers can use it to coordinate product promotions, lead generation campaigns, print-to-digital journeys, and in-store activations. Educators can use it to structure access to assignments, lesson extensions, digital portfolios, campus resources, or classroom stations. Event teams can use it for ticketing support, maps, session schedules, sponsor promotions, and attendee engagement. Retailers can use it for shelf-level product information, reviews, loyalty programs, coupons, and reorder links. Nonprofits can use it for donation appeals, volunteer forms, impact stories, campaign updates, and community outreach.
Different teams can adapt the worksheet by emphasizing the sections most relevant to their goals. A marketing team may spend more time on audience segmentation, A/B testing, and conversion tracking. An education team may focus more on access, clarity, age-appropriate instructions, and ease of use across student devices. An event team may prioritize placement logistics, crowd flow, timing, backup links, and fast mobile experiences. A retail team may care deeply about in-store visibility, packaging constraints, and product-level analytics. A nonprofit may center the worksheet around trust signals, storytelling, donor experience, and low-friction giving. The core structure stays the same, but the details can be customized to fit each use case.
The worksheet is especially valuable when multiple stakeholders are involved. Designers, copywriters, web teams, operations staff, analysts, and campaign owners often influence a single QR campaign, and misalignment between them can weaken results. By using one shared planning document, teams can assign responsibilities, document approvals, confirm technical requirements, and preserve lessons learned after launch. That makes the worksheet not just a planning aid, but a practical system for improving cross-functional execution and building better QR campaigns over time.