QR code campaign benchmarks matter because marketers no longer ask whether people will scan, but what scan rate, conversion rate, and downstream revenue should count as success. A QR code is a machine-readable matrix barcode that opens a digital destination, while a campaign benchmark is a performance reference drawn from comparable placements, audiences, and offers. I have planned, launched, and audited QR programs across packaging, retail, events, direct mail, and out-of-home media, and the same lesson repeats every time: results vary wildly when teams compare unlike campaigns. A product label scan rate should not be judged against a stadium activation, and a loyalty sign-up offer will behave differently from a product tutorial or payment journey. This hub explains how successful QR code campaigns work, what real brands have achieved, and how to set realistic benchmarks that improve decision-making. It is designed as the central guide for anyone researching successful QR code campaigns and deciding where to invest next.
The renewed growth of successful QR code campaigns comes from three shifts. First, smartphone cameras now read codes natively, removing app friction that stalled adoption in the early 2010s. Second, privacy changes have made first-party data more valuable, and QR codes create a direct path from physical touchpoint to owned digital experience. Third, operational costs are low: a dynamic code, a clear call to action, and a mobile landing page can outperform more expensive channels when execution is disciplined. Industry studies from MobileIron, GS1, and major platform vendors consistently show that consumers use QR codes for payments, menus, product information, coupons, and authentication. Brands from Coca-Cola to Nike, Burger King to Tesco, have turned a simple square into a measurable bridge between media and action. The practical question is not just which campaigns went viral; it is what repeatable patterns separate one-off novelty from sustainable performance.
What Successful QR Code Campaigns Benchmark
Successful QR code campaigns are measured across four layers: scan behavior, landing-page engagement, conversion action, and business impact. Scan behavior includes scan rate per impression, unique scanners, repeat scans, device split, time of day, and geographic distribution. Engagement includes page load speed, bounce rate, scroll depth, video completion, and click-through to the next step. Conversion action depends on the campaign goal: coupon save, email capture, app install, product registration, cart completion, donation, or payment. Business impact looks at revenue per scan, cost per acquisition, incremental sales lift, customer lifetime value, and retention. In my experience, teams fail when they stop at scan count. A code that generates fewer scans but higher purchase intent often beats a high-traffic placement that attracts curiosity with no commercial payoff. Good benchmarks therefore connect physical context to the outcome that matters financially.
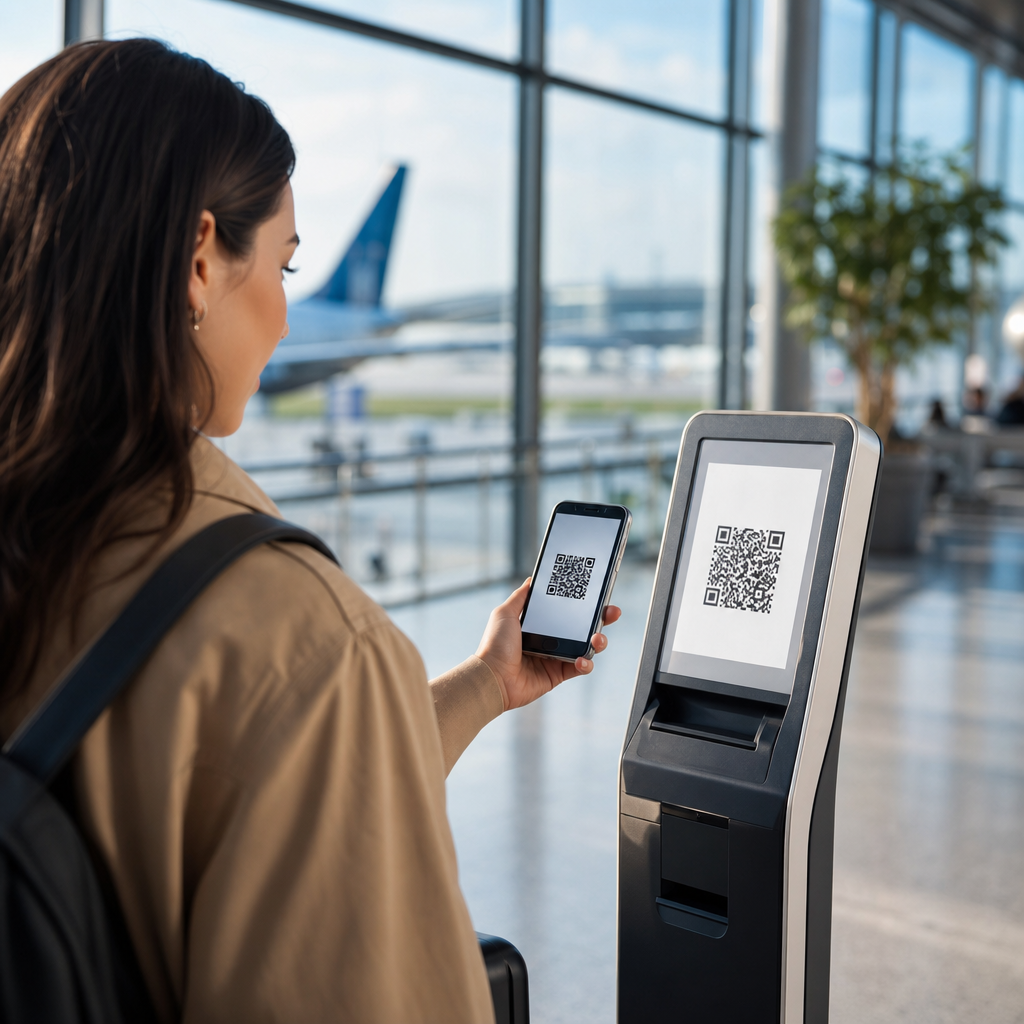
Context determines benchmark quality. A QR code on transit shelter media may earn a lower scan rate than one printed on product packaging, but transit often delivers higher reach and stronger geographic targeting. Direct mail usually produces more deliberate scans because the recipient handles the piece in a lower-distraction setting. In-store shelf talkers can convert well when they answer a friction point, such as ingredient details, compatibility, or a limited-time coupon. Event badges and booth signage often produce repeat scans from the same attendee, so unique-user measurement matters. Dynamic QR platforms such as Bitly, Flowcode, Scanova, Beaconstac, and QR Code Generator Pro let teams tag destination URLs with UTM parameters and swap landing pages without reprinting assets. That flexibility is essential for benchmarking because the destination, not just the printed code, often determines whether a campaign turns attention into action.
Benchmarks by Channel and Placement
Packaging is one of the strongest environments for successful QR code campaigns because the consumer already has the product in hand. Benchmarks vary by category, but scans on food, beverage, cosmetics, and consumer electronics packaging often outperform broad-reach placements because the code answers immediate questions: recipe ideas, sourcing, instructions, warranty registration, or authenticity checks. I have seen packaging programs lift repeat engagement when the code promises changing value, such as seasonal content or loyalty rewards, instead of a static brochure page. By contrast, out-of-home benchmarks are usually lower on raw scan rate but can create strong assisted conversions when the landing page captures intent and retargets later. Billboards on highways are poor QR environments because safety and speed reduce action; street-level posters, transit shelters, and experiential installations perform better because users can stop comfortably.
Retail signage sits between these extremes. Shelf-edge labels, endcaps, window vinyls, and point-of-sale displays can drive meaningful scans if the promise is specific and immediate. “Scan for details” underperforms “Scan for today’s 20% coupon” or “Scan to compare shades on your phone.” Restaurant table tents and quick-service packaging became mainstream QR placements during the pandemic, but the best operators kept them because they reduced menu printing costs while enabling upsells, loyalty enrollment, and customer feedback. Direct mail is still underrated. When variable QR codes map each recipient to a personalized landing page, response rates can beat generic digital traffic because message match is so high. Event and trade-show placements are another distinct benchmark category. Booth traffic, session slides, badges, and handouts can produce excellent lead quality, but only if the post-scan form is short and the offer is tied to a clear next step, such as a demo slot or downloadable spec sheet.
| Channel | Typical Strength | Common Weakness | Best Success Metric |
|---|---|---|---|
| Packaging | High intent, strong repeat access | Static destinations become stale | Repeat scans and registrations |
| Retail signage | Immediate purchase influence | Poor placement reduces visibility | Coupon redemption or add-to-cart |
| Direct mail | Personalization and message match | Creative fatigue over time | Lead rate and revenue per recipient |
| Out-of-home | High reach and local targeting | Lower scan convenience | Cost per qualified visit |
| Events | Excellent lead intent | Duplicate scans from attendees | Meetings booked or pipeline created |
Real Brand Examples and What They Teach
Burger King’s “QR Whopper” campaign is still one of the clearest examples of a QR code tied to a single, obvious value exchange. During the promotion, floating QR codes on television invited viewers to scan for a free Whopper through the app with purchase. The creative worked because the reward was instantly understood, the timing created urgency, and the app captured first-party customer data beyond the initial redemption. The benchmark lesson is simple: entertainment increased attention, but the campaign succeeded because the post-scan path was tightly engineered. Many brands copy the spectacle and forget the operational core. If the app store opens instead of the offer, or if account creation takes too long, scan volume becomes wasted demand.
Coca-Cola has used QR codes across packaging and experiential activations to connect consumers with music, loyalty, and limited-edition content. The strongest executions create a reason to scan that extends the product moment rather than interrupting it. On-pack codes linked to promotions or digital experiences can generate broad participation because every unit becomes a media placement. The benchmark insight here is frequency. Packaging is not a one-day blast; it is a distributed channel that compounds over weeks as inventory moves through stores and homes. That changes how success should be evaluated. Instead of judging only launch-week spikes, marketers should watch sustained daily scans, repeat visitors, and the percentage of scans that identify or join a loyalty program.
Nike and Adidas have used QR codes in stores and on products to bridge physical shopping with digital depth. In footwear and apparel, codes can surface size availability, styling content, sustainability information, or authentication support for premium items. These campaigns teach an important benchmark principle: utility often outperforms novelty. Customers scan when the code removes friction they already feel. I have repeatedly seen instructional, comparison, and inventory-check experiences beat brand videos on both engagement and conversion. Tesco’s earlier virtual store initiative in South Korea, while not a standard QR poster campaign in today’s sense, proved that scanning products from a physical display into a digital shopping journey can change purchase behavior when convenience is genuine. The lesson remains relevant for modern grocery, pharmacy, and home improvement retailers.
What Drives Higher Scan and Conversion Rates
The largest controllable factor in successful QR code campaigns is the call to action. Specificity wins. “Scan to get 15% off,” “Scan to watch setup in 30 seconds,” and “Scan to verify authenticity” outperform generic invitations because they answer the user’s question before the camera opens. Placement and size matter too. Codes need contrast, whitespace, and a comfortable scanning distance. Glossy curved surfaces, tiny labels, low-light corners, and cluttered layouts depress performance even when the offer is good. Error correction helps with damaged prints, but it is not a substitute for sensible production. Brands should test real devices under real conditions before launch, not just approve artwork on a desktop PDF.
The landing page is where benchmarks are won or lost. A fast mobile page with one primary action consistently beats a desktop-style microsite stuffed with navigation. Core Web Vitals, simplified forms, Apple Pay or Google Pay where relevant, and autofill support can materially improve conversion. Message match is critical: the page headline should repeat the promise from the sign, package, or mail piece. If the code says “Scan for ingredients,” the user should not land on a generic homepage. Trust markers also matter. Recognizable branding, secure domains, privacy disclosure, and clear data use reduce abandonment. In regulated sectors such as healthcare, alcohol, and financial services, compliance review must happen early so legal disclaimers do not break usability at the last minute.
Audience and incentive design create the final lift. Younger consumers may be more accustomed to scanning, but age alone is not destiny; relevance beats demographics. A practical utility for a parent in a store aisle can outperform a trendy activation aimed at Gen Z. Incentives should fit the economics of the category. A snack brand may offer sweepstakes entry, while a high-consideration electronics brand may offer setup guidance, extended warranty registration, or comparison tools. The strongest successful QR code campaigns also segment traffic. Dynamic redirects can send new users to an explainer, returning users to a loyalty dashboard, and retail traffic to a store-specific offer. That sophistication is now accessible without enterprise complexity.
How to Set Realistic Benchmarks for Your Brand
Start by defining the job of the QR code in one sentence. Is it meant to educate, capture leads, drive a sale, register a product, or shorten a service journey? Then choose one primary metric and two supporting metrics. For example, a packaging campaign might prioritize product registrations, supported by unique scans and repeat visits within thirty days. A retail endcap might prioritize coupon redemptions, supported by scan rate and basket attachment. Benchmarks should be directional at first, based on channel norms, then refined with your own data after a pilot. I recommend establishing a baseline from at least two weeks of traffic, controlling for store count, creative rotation, and offer timing before making broad judgments.
Benchmark quality improves when campaigns are compared by environment, incentive, and audience intent. Use A/B tests on the call to action, destination, and visual prominence. Track scans separately from sessions because some devices and apps may prefetch URLs. Deduplicate repeat users when evaluating reach, but preserve repeat behavior when measuring loyalty or product support value. Connect QR analytics to CRM, commerce, or CDP systems where possible, using server-side events and consistent campaign taxonomy. That is how QR codes move from novelty to accountable media. Successful QR code campaigns are not mysterious. They combine a clear promise, convenient context, fast mobile experience, and disciplined measurement. Use this hub as the foundation for deeper case studies on packaging, retail, direct mail, events, and out-of-home programs, then build your own benchmark library. The brands that win are the ones that treat every scan as the start of a customer relationship. Review your current placements, tighten the value exchange, and launch a controlled test this quarter.
Frequently Asked Questions
What are realistic QR code campaign benchmarks for scan rate, conversion rate, and revenue?
Realistic QR code benchmarks depend heavily on placement, audience intent, creative execution, and the value exchange behind the scan. In practice, marketers should avoid asking for one universal benchmark and instead compare performance against similar environments. A QR code on product packaging, for example, usually behaves differently than a QR code in direct mail, at a live event, or on out-of-home media. Packaging often delivers steady but modest scan activity over time because the consumer is already holding the product and can scan at a convenient moment. Event activations may produce higher scan rates because the audience is physically present, engaged, and responding to a time-sensitive prompt. Direct mail often performs best when the offer is clear, personalized, and friction is low, while retail signage can vary widely based on store traffic, visibility, and whether the shopper sees an immediate benefit.
As a practical framework, strong benchmarks should be evaluated in layers. First, measure exposure-to-scan behavior, which answers how many people who encountered the code actually scanned it. Second, measure scan-to-conversion performance, which shows whether the landing experience and offer did their job. Third, measure downstream value such as revenue per scan, revenue per converter, email capture rate, account creation, coupon redemption, or repeat purchase. A campaign with a moderate scan rate but excellent post-scan conversion can outperform one with a high scan rate and weak landing-page economics. That is why experienced marketers benchmark not only top-of-funnel activity, but also the business outcome attached to each scan.
Brands should also define success by campaign objective. If the goal is awareness, a healthy benchmark may be a cost-efficient volume of scans and strong engagement time on the destination page. If the goal is commerce, then conversion rate, average order value, and return on ad spend matter far more than raw scan count. If the goal is CRM growth, then the benchmark should center on lead quality, opt-in completion, and follow-on retention. The best benchmark is not simply “more scans.” It is a performance reference based on similar channel conditions, comparable incentives, and a clearly stated business goal.
Why do QR code benchmarks vary so much between packaging, retail, events, direct mail, and out-of-home?
QR code benchmarks vary because each environment changes user motivation, scan convenience, attention span, and timing. On packaging, the consumer is physically close to the code and often has enough time to scan, but the motivation may be weak unless the code promises something useful such as instructions, loyalty rewards, recipes, reordering, warranty registration, or exclusive content. In retail, shoppers are balancing speed, distraction, and purchase intent, so the code must compete with price tags, shelves, staff interactions, and other visual signals. At events, the audience is already in an activation mindset, which often lifts scan engagement, especially when there is a live demo, giveaway, registration step, or social component tied to the experience.
Direct mail performs differently because it reaches people in a lower-noise setting and can pair the QR code with personalization, urgency, and a very specific call to action. Recipients can read, consider, and scan on their own terms. Out-of-home media, by contrast, can deliver tremendous reach but often lower scan efficiency because the viewer may be moving, driving, at a distance, or unable to act immediately. In that setting, design clarity, dwell time, memorable messaging, and mobile-friendly landing experiences become even more important. A beautifully branded billboard QR code may generate awareness, but if the placement gives people only two or three seconds to notice, understand, and act, its direct scan benchmark will naturally differ from a QR code printed on a countertop display.
This is why apples-to-apples comparison matters. A brand should not compare an event booth scan rate to a bus shelter scan rate and call one a failure without adjusting for context. The right benchmarking process segments campaigns by medium, audience, offer type, creative treatment, and action difficulty. Once that segmentation is in place, patterns become much more useful. Marketers can then see which channels produce high curiosity, which produce high intent, which produce efficient leads, and which deserve optimization before more budget is committed.
What factors most strongly influence whether a QR code campaign beats benchmark expectations?
The biggest performance drivers are usually not the QR code itself, but the surrounding experience. The call to action is one of the strongest variables. People need a compelling reason to scan now, not a vague suggestion that something interesting might happen. “Scan to save 20%,” “Scan to see the menu,” “Scan to register for the giveaway,” or “Scan to unlock setup instructions” tend to outperform generic prompts because they tell the user exactly what they will get. Clarity reduces hesitation, and reduced hesitation lifts scan rate.
Placement quality matters just as much. A code that is too small, poorly contrasted, curved around packaging, placed behind glare, or shown where people cannot comfortably pause will underperform even if the offer is strong. The surrounding design also matters. QR codes work best when they are visually supported by a headline, a benefit statement, and enough white space to stand out. In retail and outdoor settings, readability from a practical scanning distance is critical. At events and on printed materials, accessibility and line of sight can have an outsized effect on results.
The mobile destination is another major lever. Many campaigns lose performance after the scan because the landing page loads slowly, asks for too much too early, or fails to match the promise that triggered the scan. If the code advertises a coupon, the page should reveal the coupon immediately. If it promises product details, those details should be instantly visible without forcing multiple taps. Strong-performing brands reduce friction at every stage: fast load speed, mobile-first layout, message match, simple form design, and a clean path to the next action. Finally, measurement discipline plays a decisive role. Brands that use unique codes or unique tracking parameters by placement, audience, or creative variation learn faster and optimize faster. That often becomes the difference between merely average performance and benchmark-beating performance over time.
How should brands measure QR code campaign success beyond simple scan counts?
Scan counts are a useful starting point, but they are only the surface layer of performance. Mature QR measurement tracks the full journey from exposure to action to value. A strong reporting model typically includes scans, unique scanners, repeat scans, landing-page engagement, conversion rate, cost per scan, cost per conversion, revenue per scan, and total attributable revenue. Depending on the campaign objective, brands may also track coupon redemption, email sign-ups, app downloads, store visits, add-to-cart rate, average order value, retention, or assisted conversions that happen later through another channel.
It is also important to distinguish between curiosity and intent. A campaign can generate a large number of scans because the creative is eye-catching, but if those users bounce immediately, the campaign may be overperforming visually and underperforming commercially. On the other hand, a smaller but highly qualified audience may scan less often and convert at a much higher rate. That is why experienced marketers pay close attention to post-scan quality indicators such as time on site, scroll depth, completion rate, lead quality, purchase value, and repeat behavior. These metrics reveal whether the campaign is attracting the right user and delivering the right experience.
Attribution should also be approached carefully. Not every successful QR campaign creates an instant purchase. Some move users into a broader funnel where they subscribe, research, compare, return later, and convert through another touchpoint. Using tracked URLs, channel-specific landing pages, CRM source capture, and analytics event mapping can help connect scans to downstream revenue more accurately. The most useful benchmark report does not just say, “We got 5,000 scans.” It says, “This placement produced the most efficient traffic, this creative produced the highest conversion rate, this audience produced the strongest revenue per scan, and this optimization increased performance relative to prior comparable campaigns.”
How can a brand improve an underperforming QR code campaign using benchmarks from real-world programs?
The fastest way to improve an underperforming QR code campaign is to diagnose where the drop-off is happening. If impressions or foot traffic are healthy but scans are weak, the issue is usually visibility, incentive, or placement context. In that case, the brand should test a stronger call to action, a more immediate benefit, better size and contrast, or a more accessible location. If scans are strong but conversions are weak, the problem is likely the landing-page experience, message mismatch, or offer quality. That means the next optimization should focus on mobile speed, form friction, page clarity, trust elements, and how directly the destination fulfills the promise made next to the code.
Real-world benchmarking helps teams prioritize the right fix. For example, if a direct mail QR campaign has a respectable scan rate compared with similar mail programs but a below-benchmark completion rate, there is little value in changing the print creative first. The smart move is to improve the post-scan flow. If an out-of-home placement has far lower scan activity than comparable placements with similar dwell time, then the issue may be insufficient readability, poor environmental fit, or a weak offer. Benchmarks are most useful when they point to the precise stage that is underperforming rather than encouraging broad, unfocused changes.
Brands should also adopt structured testing