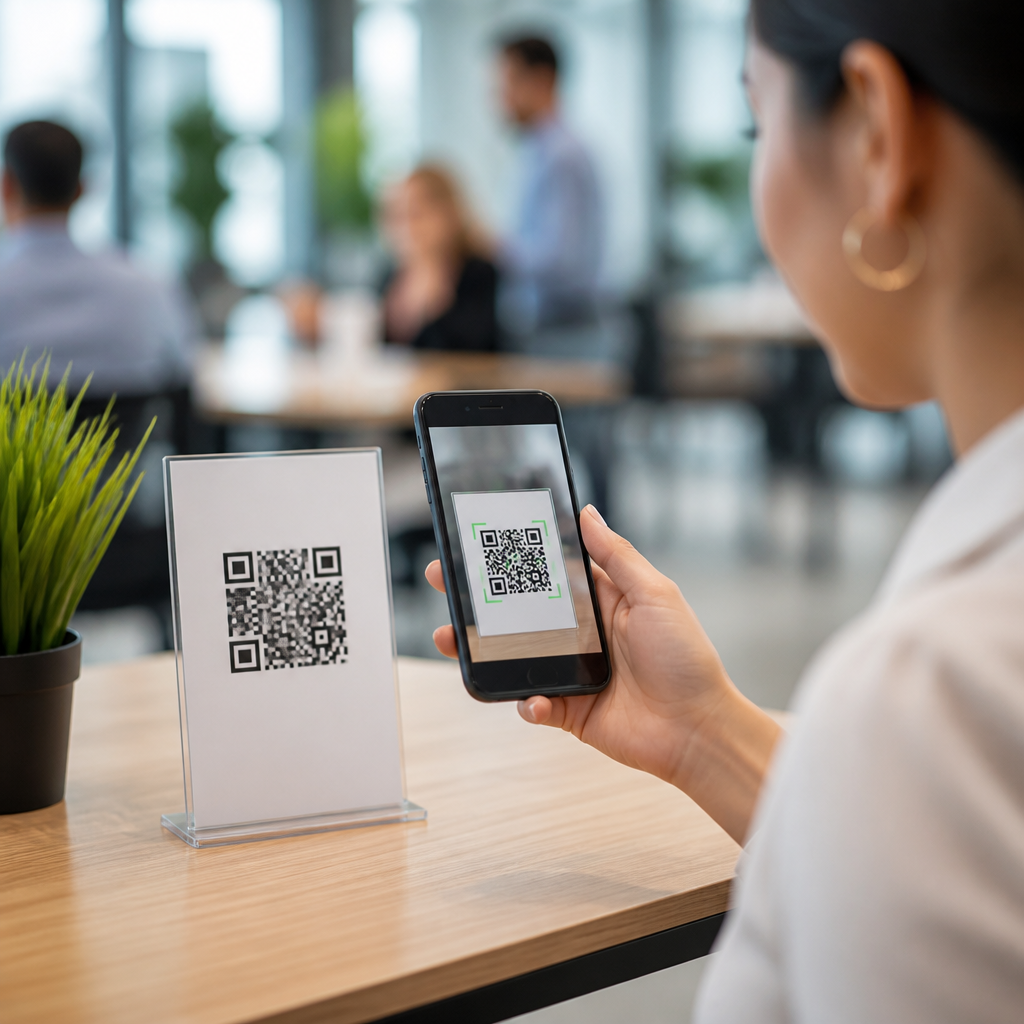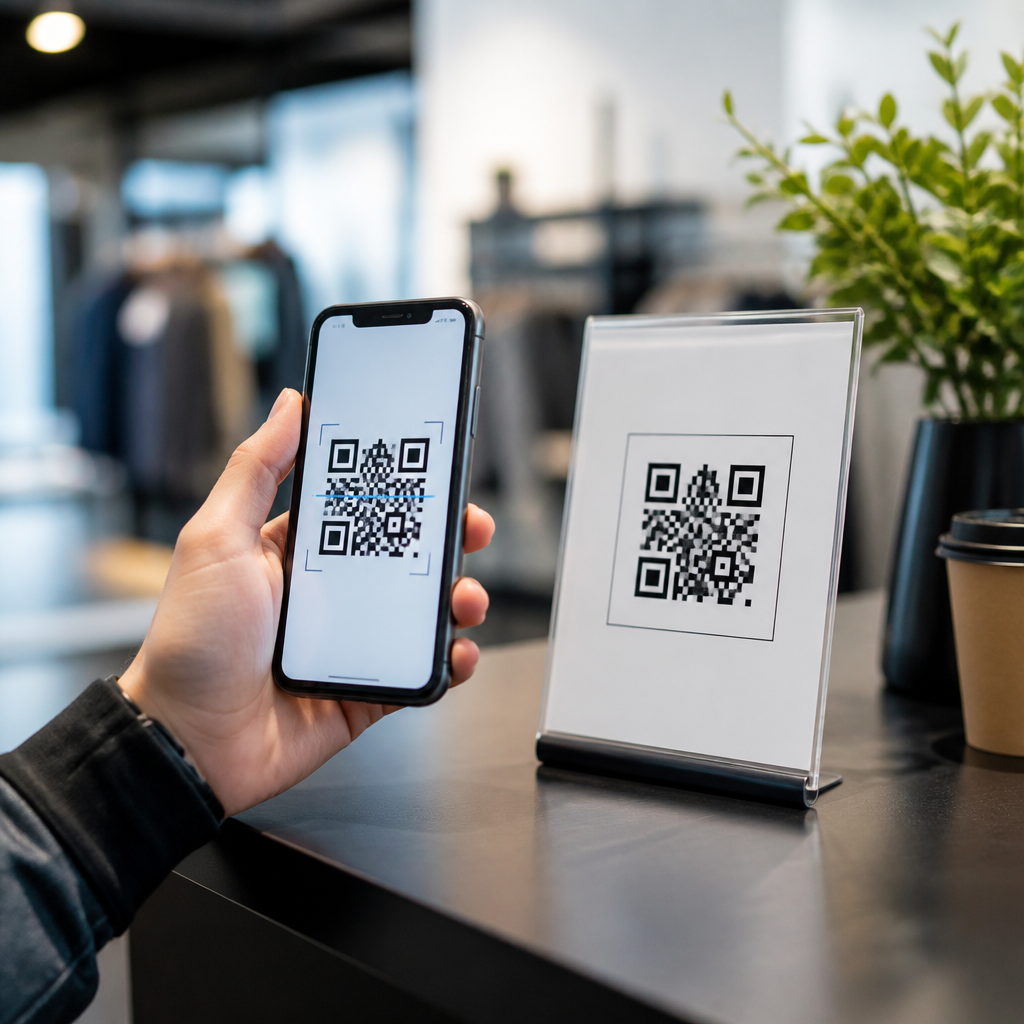

Tracking QR code performance turns a static square into a measurable marketing asset. A QR code can connect print, packaging, signage, events, direct mail, and in-store displays to a digital destination, but the real value appears only when you can measure scans, visitors, conversions, and downstream revenue. In practice, tracking QR code performance means attaching analytics to every code, defining what success looks like, and reviewing data often enough to improve campaigns. For teams building a repeatable process, this guide serves as a central resource for step-by-step tutorials under QR Code Tutorials, Guides & Resources.
Marketers often treat QR codes as a distribution tool instead of a performance channel. That is a mistake. I have seen the difference firsthand: a restaurant menu code that simply opened a PDF generated curiosity, but a tracked code tied to campaign tags revealed scan peaks by lunch hour, device type, repeat visits, and which table tents drove the most online orders. The same principle applies to product packaging, trade show badges, billboards, flyers, warranty cards, and classroom handouts. When you track each code correctly, you can compare placements, creative variants, audience segments, and conversion paths with the same rigor used for paid search or email.
Three terms matter from the start. A static QR code contains a fixed destination and usually offers limited measurement unless analytics are added through the landing page. A dynamic QR code routes through a managed short URL before forwarding the user, which enables editable destinations and richer reporting. A conversion is the action you actually care about after the scan, such as a purchase, form submission, app install, booking, coupon redemption, or call. The goal of a proper setup is not just to count scans. It is to connect scans to business outcomes.
This hub article explains the full workflow: how to choose a QR code platform, structure URLs, use campaign parameters, connect analytics, set up events and goals, segment data, compare placements, troubleshoot common errors, and build a reporting routine. It also points naturally to the step-by-step tutorial topics every team eventually needs, from tracking QR codes in Google Analytics 4 to measuring offline conversions from printed materials. If you want every future QR code tutorial to fit into one practical system, start here and treat performance tracking as part of campaign design, not an afterthought.
Start with clear measurement goals and a naming system
The first step in tracking QR code performance is deciding what question each code must answer. “How many scans did we get?” is rarely enough. Better questions are: Which poster location drove the most unique visitors? Did event attendees who scanned at the booth request a demo? Did product packaging scans lead to registrations within seven days? Did the direct mail version with a discount outperform the version with a product video? A campaign without a defined question usually produces interesting numbers but weak decisions.
Build a naming convention before generating any code. I recommend a structure that includes channel, campaign, placement, audience, version, and date. For example: qr_spring_launch_store_window_chicago_v1_2026. Use the same convention in your QR platform, URL parameters, creative briefs, and analytics dashboards. Consistent names make reporting easier and prevent the common problem of “final-final-new” labels that no one can interpret three months later.
You also need to define key performance indicators at three levels. First are scan metrics: total scans, unique scans, scan rate by location, time, or device. Second are engagement metrics: sessions, bounce rate, pages per session, engaged sessions, and return visitors. Third are outcome metrics: purchases, leads, downloads, calls, coupon redemptions, or revenue. This layered approach matters because a code can earn many scans but fail commercially if the landing page loads slowly or the offer misses the audience.
For teams creating multiple tutorials and campaigns, this is the foundational process article. Every later how-to guide, whether for retail shelf talkers or B2B event signage, depends on clear objectives and standard naming.
Choose dynamic QR codes and build trackable URLs
Dynamic QR codes are the preferred option for performance tracking because they provide flexibility and control. If the destination page changes, you can update the redirect without reprinting the code. If a code appears on packaging with a long shelf life, that flexibility is essential. Dynamic platforms also log scan metadata such as timestamp, approximate location, operating system, and device category. Static codes still have uses, especially for permanent public information, but they are less forgiving when campaigns evolve.
The destination URL should include campaign parameters so analytics tools can identify traffic sources precisely. The standard practice is to append UTM parameters: source, medium, campaign, content, and sometimes term. For a flyer promoting a free consultation, a clean example would be a landing page URL tagged with source set to qr, medium set to print, campaign set to summer_consultation, and content set to flyer_frontdesk. These values let you separate one QR code from another in GA4, Adobe Analytics, or other reporting systems.
Avoid sending users to a homepage unless there is no better option. Deep-link to the most relevant page or experience: product page, app download page, reservation flow, event registration form, support article, or digital menu. Better alignment increases conversion rate and makes attribution cleaner. I have repeatedly seen conversion rates double when a generic homepage QR code was replaced with a dedicated landing page that matched the promise on the printed material.
Keep URLs governed and documented. Many organizations create QR codes from personal accounts, free tools, or design software exports, then lose ownership later. Use an approved platform, centralize credentials, and maintain a QR inventory sheet that records owner, purpose, live URL, redirect URL, print locations, creation date, and retirement date.
Connect QR scans to analytics and conversion tracking
Once URLs are tagged, connect the experience to analytics. For most organizations, that means configuring Google Analytics 4 with clearly defined events and conversions. At minimum, ensure page views, session attribution, and key events are captured on the landing page. Then mark important events as conversions, such as generate_lead, purchase, sign_up, file_download, or contact_click. If your CRM accepts hidden form fields, pass through campaign parameters so lead records retain the QR source data.
Server-side and platform integrations strengthen accuracy. If your site uses Google Tag Manager, set triggers for button clicks, outbound links, video starts, coupon reveals, and form submissions. If you use Shopify, HubSpot, Salesforce, Marketo, or Klaviyo, connect campaign data so scans can be tied to revenue or lifecycle stage. For app campaigns, use a mobile measurement partner such as AppsFlyer or Adjust to attribute installs and in-app events more reliably.
Testing is nonnegotiable. Before printing anything, scan each code on iPhone and Android, over Wi-Fi and mobile data, and confirm the landing page loads quickly, UTM parameters persist, consent settings behave as expected, and the intended events fire in DebugView or your analytics tool. Validate redirects with status code checks. A 302 redirect can work, but chains of redirects can slow the experience and strip parameters in some environments. Simpler paths are better.
If you need a practical setup sequence, use the following workflow.
| Step | What to do | Why it matters |
|---|---|---|
| 1 | Define campaign goal and conversion event | Prevents vanity reporting and aligns metrics with outcomes |
| 2 | Create a tagged destination URL with consistent UTM values | Enables campaign-level attribution inside analytics tools |
| 3 | Generate a dynamic QR code in an approved platform | Allows editable redirects and scan-level reporting |
| 4 | Configure events and conversions in GA4 or your analytics stack | Connects scans to business actions such as leads or sales |
| 5 | Test across devices, networks, and printed proofs | Catches broken links, slow pages, and tracking failures before launch |
| 6 | Monitor results by placement, audience, and creative version | Shows where to optimize spend, design, and messaging |
Measure the metrics that actually improve campaigns
The best QR code reporting combines platform data with on-site behavior. Scan count is useful, but unique scans are more revealing because they reduce inflation from repeat activity. Scan time helps identify peak response periods. Approximate location can validate placement quality. Device type can influence landing page design choices, especially if one audience skews older Android or newer iPhone. However, none of these metrics proves business value by itself.
On-site engagement metrics explain what happened after the scan. In GA4, review engaged sessions, engagement rate, average engagement time, and path exploration. Compare QR traffic against email, paid social, and organic traffic. In one campaign I audited for a regional gym chain, lobby poster scans had lower volume than Instagram traffic but a far higher membership trial conversion rate because the audience already had local intent. That insight changed budget allocation for in-club creative and signage.
Outcome metrics matter most. For ecommerce, track add-to-cart rate, checkout starts, purchase conversion rate, average order value, and revenue per scan. For lead generation, track form completion rate, qualified lead rate, meeting bookings, and downstream pipeline. For restaurants, use menu views, online orders, reservations, and coupon redemptions. For healthcare or education, include appointment requests, admissions inquiries, or resource downloads, while respecting privacy and consent rules.
Benchmarks vary widely by industry and placement, so avoid universal promises. A product package QR code may generate lower scan volume than an event badge, yet produce more valuable repeat interactions over time. Compare codes against comparable contexts, not against every campaign in the portfolio.
Optimize landing pages, creative, and placement
Good tracking exposes weak links in the user journey. If scans are high but conversions are low, start with landing page relevance and speed. Pages linked from QR codes should load fast on mobile, present one clear action above the fold, and mirror the promise made by the physical asset. If the sign says “Get 10% off today,” the landing page should show that offer immediately, not force users to hunt through site navigation.
Creative details matter more than many teams expect. Add a visible call to action near the code, explain the benefit of scanning, and give users a reason to trust the destination. “Scan for installation guide” outperforms a code with no context. “Scan to compare prices and reviews” outperforms “Learn more.” Contrast, print size, quiet zone, and placement height also affect scanability. ISO/IEC 18004 defines technical standards for QR code symbols, and following those basics reduces read errors in the field.
Placement testing often produces the fastest gains. Move a code from a store entrance to a checkout counter and behavior changes because user intent changes. A trade show code on a booth wall may underperform the same code on a demo screen or handout because dwell time differs. Use unique codes for each placement so optimization is based on evidence rather than assumptions.
Common step-by-step tutorials that branch from this hub include how to A/B test QR code landing pages, how to track QR codes on packaging, how to measure direct mail response, and how to attribute in-store signage to online purchases. All of them depend on isolating variables with distinct codes and disciplined reporting.
Troubleshoot attribution gaps and maintain a reporting routine
QR tracking can fail in subtle ways. The most common issues are broken redirects, stripped UTM parameters, missing consent configuration, duplicate codes that share one URL, offline conversion events that never sync back to analytics, and teams reusing old codes for new campaigns. Another frequent problem is fragmented reporting: the QR platform reports scans, GA4 reports sessions, and the CRM reports leads, but no one reconciles why the numbers differ. They differ because each system measures a different stage with different rules.
Build a weekly or campaign-based reporting routine. Start with scan trends from the QR platform, then compare sessions and conversions in analytics, then review lead quality or revenue in the CRM or commerce platform. Investigate large drop-offs between stages. If scans are strong but sessions are weak, the redirect or page load may be failing. If sessions are strong but conversions are weak, the offer or form may be the issue. If leads are plentiful but low quality, the call to action may be attracting the wrong audience.
Documentation is part of performance tracking. Keep a living dashboard and a simple change log that notes when you edited redirects, swapped creative, changed placement, or updated the landing page. Without that record, performance swings are hard to interpret. For long-running programs, create sunset rules so expired promotions, retired event pages, and discontinued products do not leave dead QR codes in the market.
Tracking QR code performance is ultimately a discipline, not a one-time setup. When you define goals, use dynamic codes, tag URLs correctly, connect analytics, test thoroughly, and review outcomes consistently, QR codes become accountable channels that improve with each campaign. Use this hub as your starting framework, then apply it to every tutorial in your QR Code Tutorials, Guides & Resources library. Build your measurement system now, and the next QR campaign you launch will produce insight, not just scans.
Frequently Asked Questions
1. What does it really mean to track QR code performance?
Tracking QR code performance means measuring what happens before, during, and after someone scans a QR code. At the most basic level, this includes scan volume, scan time, device type, location, and the destination URL that was visited. At a more useful business level, it means connecting those scans to downstream actions such as form submissions, purchases, app downloads, coupon redemptions, appointment bookings, or any other conversion that matters to your campaign. In other words, the QR code is not just a bridge from offline to online; it becomes a measurable touchpoint in your marketing funnel.
In practice, effective tracking usually starts with using a dynamic QR code rather than a static one. A dynamic QR code routes the user through a trackable short URL or redirect, which allows you to collect analytics and update the destination later if needed. From there, you typically add UTM parameters so platforms like Google Analytics can attribute traffic correctly. Once the visitor lands on your page, you can track on-site behavior such as bounce rate, pages viewed, conversions, and revenue. When set up correctly, QR code tracking helps you understand not only how many people scanned, but also which placements, messages, designs, and offers actually produced results.
2. What metrics should I track to measure QR code success?
The right metrics depend on your goal, but a strong measurement framework usually includes three levels: engagement metrics, website behavior metrics, and business outcome metrics. Engagement metrics include total scans, unique scans, repeat scans, scan location, scan date and time, operating system, and device type. These numbers help you understand where, when, and how people are interacting with your code. For example, if a code on product packaging gets many scans but a code on in-store signage gets very few, that tells you something important about placement and visibility.
Website behavior metrics show what users do after the scan. These often include sessions, time on page, pages per session, bounce rate, click-through rate to key pages, and exit rate. If people scan the QR code but leave immediately, the landing page, offer, or audience alignment may need work. If they explore multiple pages, sign up for an email list, or begin checkout, that indicates stronger traffic quality.
The most important level is business outcomes. This includes conversions, conversion rate, cost per conversion, average order value, revenue generated, lead quality, and customer lifetime value when available. If your QR code campaign supports a sales process instead of direct ecommerce, you may also track booked demos, phone calls, store visits, or redeemed promotions. The key is to define success before launch. A campaign designed to build awareness should not be judged by the exact same standards as one designed to drive immediate purchases. When you align metrics with campaign objectives, the data becomes actionable instead of just interesting.
3. How do I set up QR code tracking step by step?
A reliable setup starts with defining the campaign goal. Decide whether the QR code is meant to generate sales, capture leads, drive event registrations, increase app installs, or support another measurable action. Once the goal is clear, create a dedicated landing page or choose a destination that is closely matched to the offer or message connected to the QR code. Relevance matters because strong tracking is not only about measurement; it is also about improving conversion rates.
Next, build a trackable URL. In most cases, this means adding UTM parameters such as source, medium, campaign, content, and sometimes term. For example, a QR code placed on a trade show banner should be tagged differently from one on packaging or direct mail so you can compare performance accurately. Then use a dynamic QR code generator or platform that records scan activity and allows link edits later. Generate the code, test it across multiple devices, and confirm that the redirect works properly and that analytics are recording the visit.
After that, configure analytics on the destination page. In Google Analytics 4, set up events and conversions for the actions that matter most, such as button clicks, form submissions, purchases, or video views. If possible, connect your analytics platform with your CRM or ecommerce system so you can follow users beyond the first visit. Before distributing the code, scan it yourself and complete the full user journey to verify that traffic source data, event tracking, and conversion reporting all appear correctly.
Finally, launch the campaign and review data on a regular schedule. Weekly reviews are often enough for ongoing campaigns, while high-volume promotions may need daily monitoring. Look for patterns in scan behavior, landing page engagement, and conversion performance. If one version of a code or placement underperforms, adjust the design, call to action, destination page, or offer. The setup process is not complete at launch; real performance tracking continues through active optimization.
4. Why should I use dynamic QR codes instead of static QR codes for tracking?
Dynamic QR codes are generally the better choice for performance tracking because they are flexible, measurable, and easier to optimize over time. A static QR code points directly to a fixed destination. Once printed or published, the URL cannot usually be changed without creating and replacing the code. That can become a major limitation if the landing page changes, the campaign expires, or you want to improve the user journey after launch. Static codes also tend to offer limited analytics unless additional tracking systems are layered on carefully.
By contrast, a dynamic QR code sends the user through a managed redirect. This makes it possible to collect scan-level data and update the final destination without changing the visual code itself. That one advantage alone is extremely valuable for printed materials, packaging, signage, menus, displays, and direct mail, where replacing the code can be expensive or impractical. Dynamic codes also make it easier to run A/B tests, rotate offers, fix broken links, or localize destinations for different audiences.
From a reporting perspective, dynamic QR codes support a more complete view of performance. You can compare unique scans to total scans, monitor activity by date or geography, and see how different placements perform. When combined with UTM-tagged URLs and website analytics, dynamic QR codes help bridge offline exposure with online conversions and revenue. For teams serious about measuring ROI and improving campaigns over time, dynamic QR codes are typically the standard approach.
5. How often should I review QR code analytics, and what should I do with the data?
The review schedule depends on campaign scale, traffic volume, and business importance, but the general rule is to check often enough to make timely improvements. For limited-run promotions, event campaigns, product launches, or paid distribution efforts, reviewing analytics daily or every few days can help catch issues early. For evergreen campaigns such as packaging, brochures, or in-store materials, weekly or biweekly reviews may be sufficient. The point is not to stare at dashboards constantly; it is to create a consistent reporting rhythm that lets you spot trends, diagnose problems, and act on new insights.
When you review the data, start by comparing scans to actual site visits and conversions. If scans are high but visits are low, there may be a redirect problem, slow page load, or poor mobile experience. If visits are strong but conversions are weak, the landing page or offer may not match user intent. If one physical placement performs better than others, consider reallocating budget, redesigning low-performing materials, or expanding the winning format. Time-based patterns can also help. You may find that scans spike during certain store hours, event sessions, or regional promotions, which can inform staffing, ad scheduling, or inventory planning.
The most valuable use of QR code analytics is optimization. Use the data to test stronger calls to action, simplify landing pages, shorten forms, change incentives, improve page speed, and personalize destination content. Over time, create benchmarks by campaign type so you know what good performance looks like for packaging, direct mail, events, and retail displays. This turns QR code tracking from a one-time reporting task into an ongoing feedback loop that improves marketing efficiency, customer experience, and measurable return on investment.